In this course project, my teammates and I designed a VA tool
based on the dataset U.S. Accidents. Unlike previous projects,
this one focused more on visualisation, which is the main
content discussed in this course. Generally speaking, our tool
provides users with the ability to perform both temporal and
spatial analysis of data related to road accidents.
Additionally, users can conduct predictions under their
preferred road and weather conditions. The web framework used is
Flask, and the backend programming language is Python. And
Vue.js framework was learned and applied in this project.
Screenshots
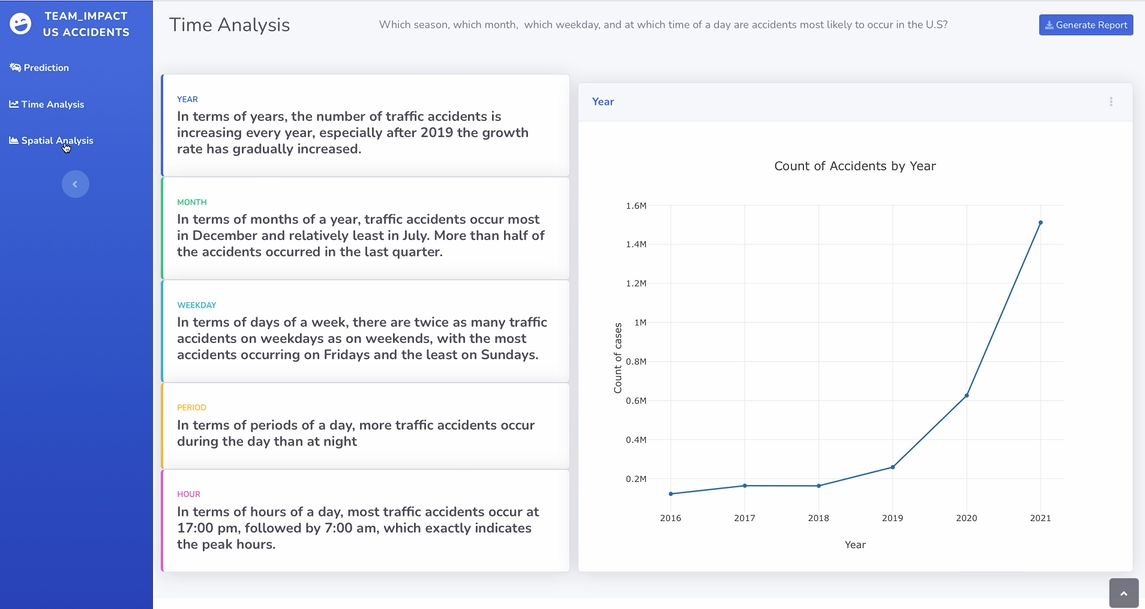
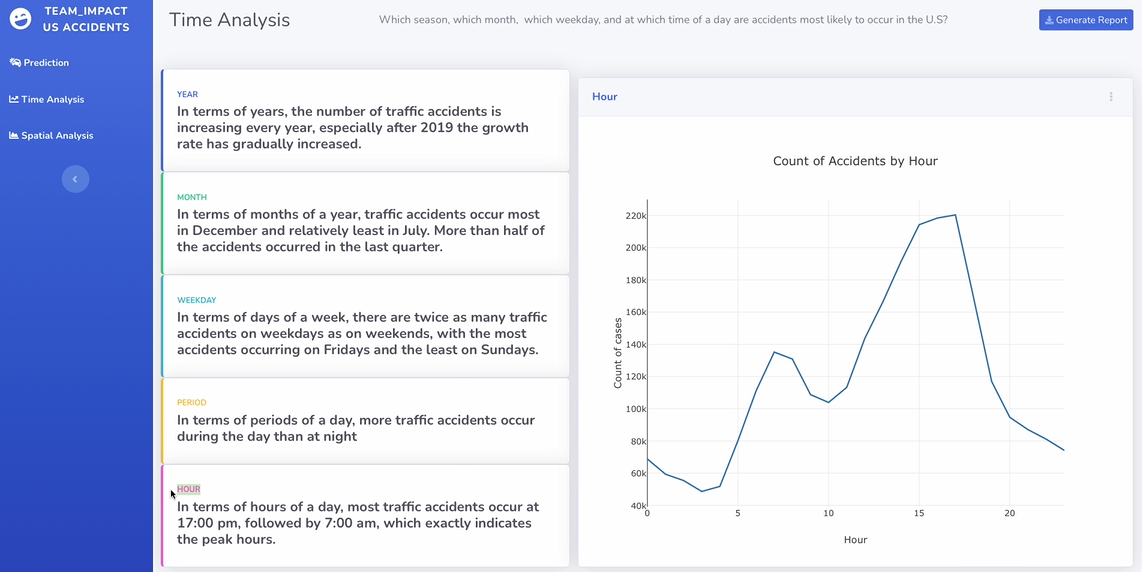
Time Analysis
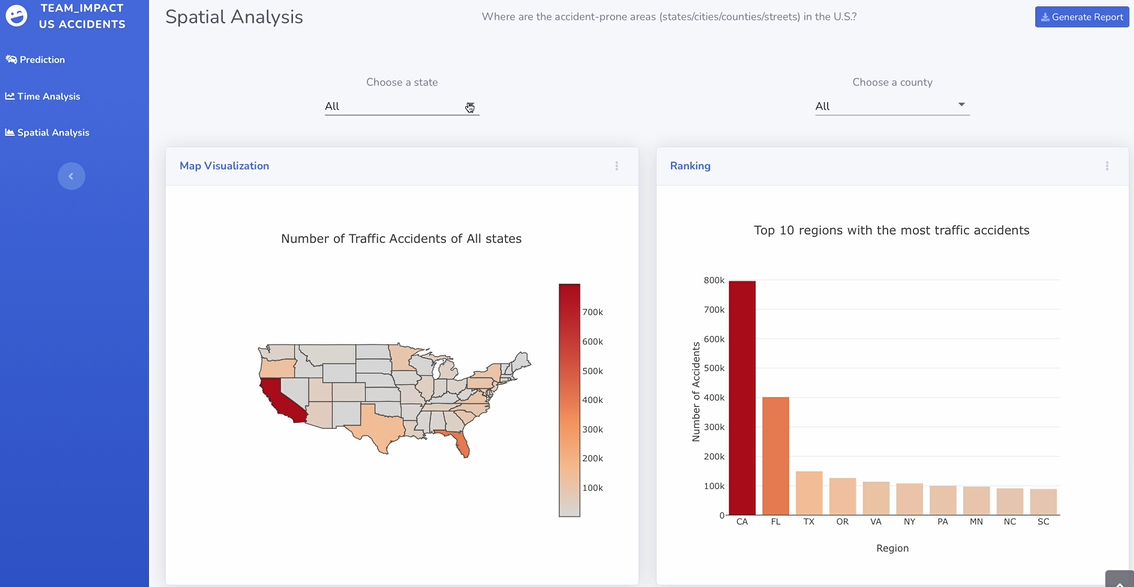
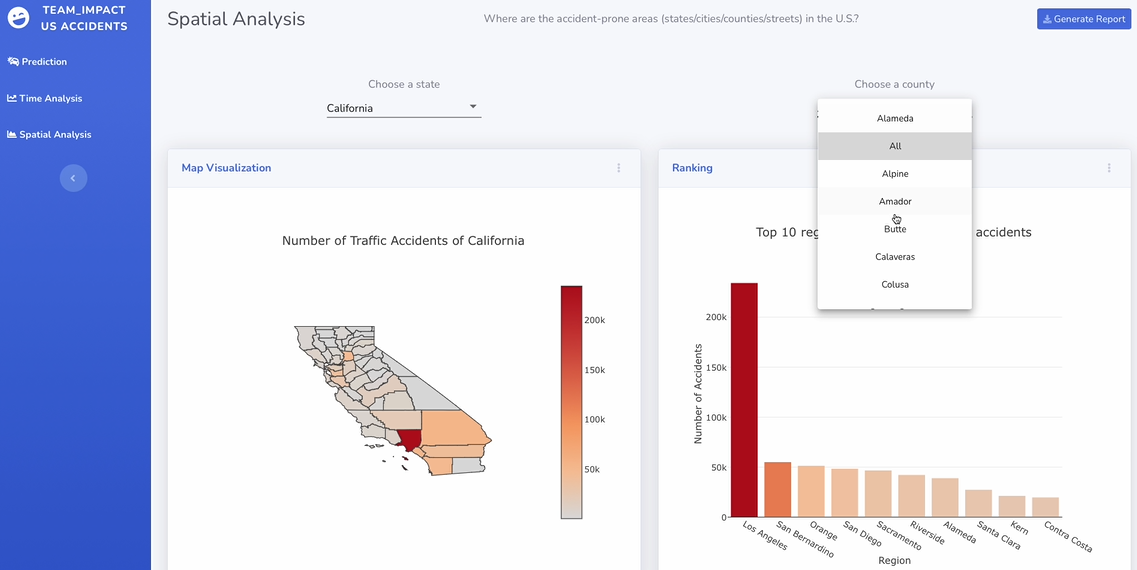
Spatial Analysis
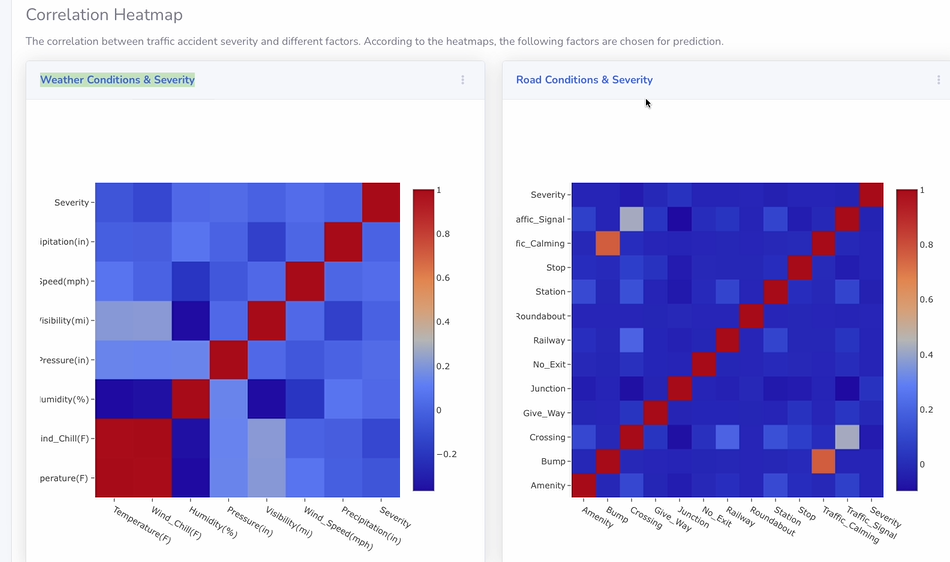
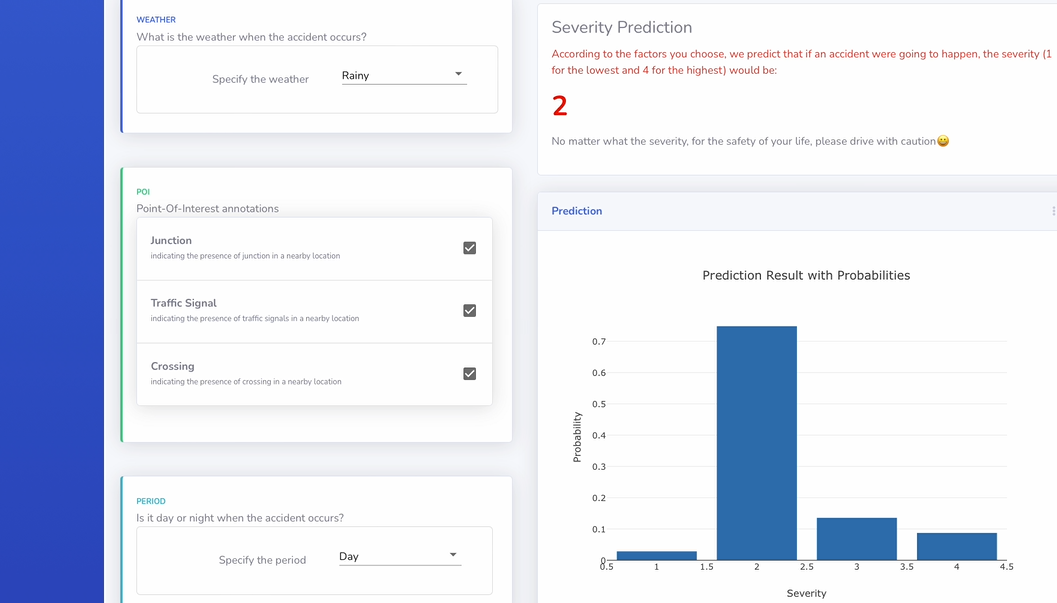
Prediction